We decided to hide some EC2 instances in private subnets (VPC). They’re accessible via bastion hosts or via API (API Gateway & Lambda). Works well, but there’s one weird issue — cold lambda start time is over 10s sometimes. We experienced even 15s. This is not acceptable and I’m seeking for answers to my questions.
- Does increased memory size help?
- Is this huge cold start time VPC related?
- Is there a difference when we do use another language?
- When the lambda container is reused?
- Does some kind of keep alive requests help?
Internet is full of answers, but they’re not clear. Wild guesses. So, I decided to quickly hack benchmark to get more accurate (still not precise) answers.
Scroll down if you’re not interested in details, but want to see results only.
UPDATE: Thanks to Moshe Ben Shoham!
Just in case anyone come across this great post, there are some good news: in re:invent 2018, the Lambda team announced Lambda cold start in VPC is going to be a none issue soon, at least according to this .
Lambda
Limits
Always learn limits of yourenemy. What’s interesting for now is number of concurrent executions. Default limit is 100.
Cold vs Hot
Lambda function runs in a sandbox environment; container. Containers can be reused. Container created for lambda A can’t be reused for lambda B, just for lambda A. There’s no clear answer when they’re reused. But I would like to know.
Every container has ephemeral disk capacity (0.5GB) mounted to /tmp. Whatever lambda stores there, it stays there if container is reused. My reuse test is very simple. Container is reused if file /tmp/perf.txt exists. If not, lambda is going to create it. Check Python, JavaScript and ClojureScript lambda function handlers.
More info about container reuse on the AWS blog. Old, but enough to get a clue.
Variants
I would like to see if there’s a difference between languages, memory sizes and VPC [not] set. I prepared several variants:
- Lambda functions in Python, JavaScript and ClojureScript
- Each configured with 128, 256, 512, 768, 1024, 1280, 1536MB of memory
- Each with and without VPC
All possible combinations, 42 lambda functions.
NOTE: There’s no way how configure CPU for lambda function. It’s tightly tied with memory size. Bigger memory size, faster CPU. This is the reason why I made different memory variants as well.
API Gateway
Limits
Again, your enemy limits. Requests per seconds default limit is 1,000. Burst 2,000. This limit is per account; don’t kill your other APIs with stress testing.
VPC
Limits
We’re interested in ENI limits. You can have 350 network interfaces per account. And here are limits per instance. I’ve got t1.micro for the benchmark purpose, so, the limit is 2.
Lambda
Lambda function is not able to access VPC resources by default. You have to set at least one subnet and at least one security group from the same VPC to allow it to access VPC resources.
NOTE: If you’re using ClojureScript, there’s pull request with VPC support. Already merged, 0.6.3-SNAPSHOT published, you can test it.
Time to learn more about ENI. It’s a virtual network interface attached to EC2 instance in your VPC. ENI can be created, deleted, attached, detached, … How does it work with Lambda container? ENI is created (or reused) during lambda/container initialisation process. This ENI is used within lambda container to allow it to communicate with your instance. Lambda ends, container is suspended, but ENI is still there. ENI is deleted when the lambda container is deleted. It takes some time and I want to know when approximately.
Also think about 350 ENIs limit when you’re designing your infrastructure. If there’s no ENI available, lambda ends with internal server error and API Gateway returns 500:
Lambda was not able to create an ENI in the VPC of the Lambda function because the limit for Network Interfaces has been reached.
Lambda role must have policy allowing to create ENI, delete ENI, … Do not create your own policies, but stick with the service one created and maintained by the AWS guys — AWSLambdaVPCAccessExecutionRole:
arn:aws:iam::aws:policy/service-role/AWSLambdaVPCAccessExecutionRole
BTW I tried to create my own policy. I did forget to add delete interface action and drained ENI pool pretty quickly. Managed to create 352 ENIs (limit is 350).
Benchmark
Methodology
None. I just wanted to see some numbers and I quickly hacked Python script which sleeps for 0, 5, 10, 15, 30, 60, 300, 600, 900, 1800, 2700 and 3600 seconds. And for every sleep cycle:
- Sequentially benchmarks predefined endpoints (/js/128, /js/256, …)
- Fires 30 requests per endpoint via 10 workers (parallel requests)
- Gathers each request-response duration and container reuse info
It fires 15,120 requests in total and it runs for more than two hours. Sleep is there to approximate time when the container is reused and when it isn’t.
Should be enough to get some data and it also shouldn’t trigger throttling on the AWS side.
Technical
Always run redeploy.sh script before you run this benchmark. Lambda functions are redeployed and all containers are trashed. You can check that the first endpoint requests (up to 10) should return no container reuse.
Output
Script generates CSV file with following values:
- sleep — in which sleep cycle (group) were requests issued (seconds)
- start — exact date and time when the batch of 30 requests was fired (IOW first request start date time from the particular batch)
- path — API Gateway path
- lang — lambda function language (js, python, cljs)
- vpc — lambda with VPC? (1 yes, 0 no)
- memory — lambda memory size (MB)
- workers — number of workers in this batch (parallel requests)
- min — fastest request-response time (milliseconds)
- max — slowest request-response time (milliseconds)
- mean — mean request-response time (milliseconds)
- d1, d2, …, d30 — first, second, … request-response duration (milliseconds)
- r1, r2, …, r30 — first, second, … request-response lambda container reuse info (1 reused, 0 not reused)
Environment conditions
No lab, no equal conditions, … Do not compare absolute values. I’m benchmarking it before lunch, in the afternoon, during night, … On my VDSL lines, over the air (LTE), at home, at work, … The only thing which is constant is region (eu-west-1) and benchmark settings (endpoints, memory sizes, VPC, number of requests per endpoint and number of workers).
Analysis
We’re going to focus on vdsl-home-morning data set for the purpose of this analysis.
Script fired 15,120 requests. Simple sort in Numbers and we already know that the slowest response took 13,106ms (13s) and the fastest one 191ms. There’re …
- 177 requests (1.2%) slower than 10s
- 403 requests (2.7%) slower than 5s
- 539 requests (3.6%) slower than 2s
- 723 requests (4.8%) slower than 1s
- 1,921 requests (8.5%) slower than 0.5s
Pretty big deviation and kind of disappointment. CSV table, raw data, … all these things are not clear. Let’s dive in, use R, plot some charts, check what’s wrong and try to fix it.
Following part was done with cooperation with Tomáš Bouda. Our math, stats, … magician. Many thanks Tobbi!
Overview
First thing to check is histogram. It shows that lot of requests are quick, but there’s something weird going on around 10 seconds.
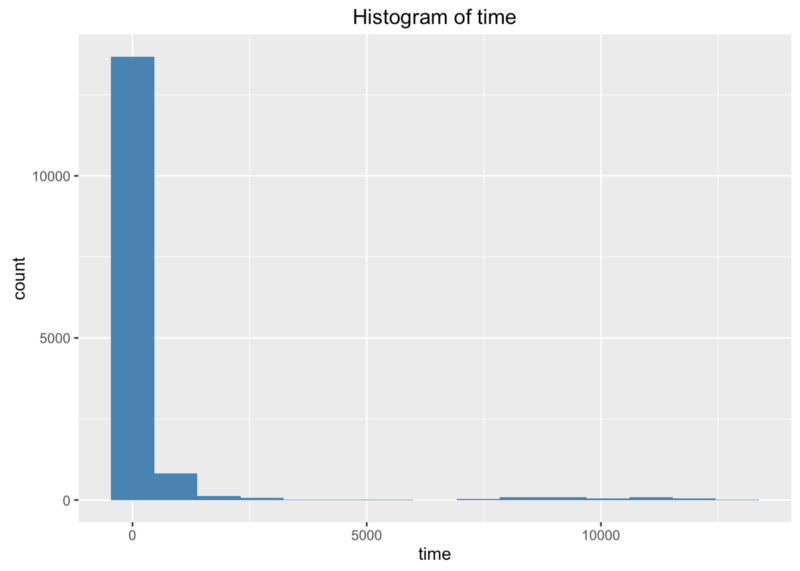
Let’s zoom in left side (limit time to 150–500ms) to check typical request duration. It’s somewhere in the 200–300ms range. Which is not super quick, but it’s not 10 seconds or more.
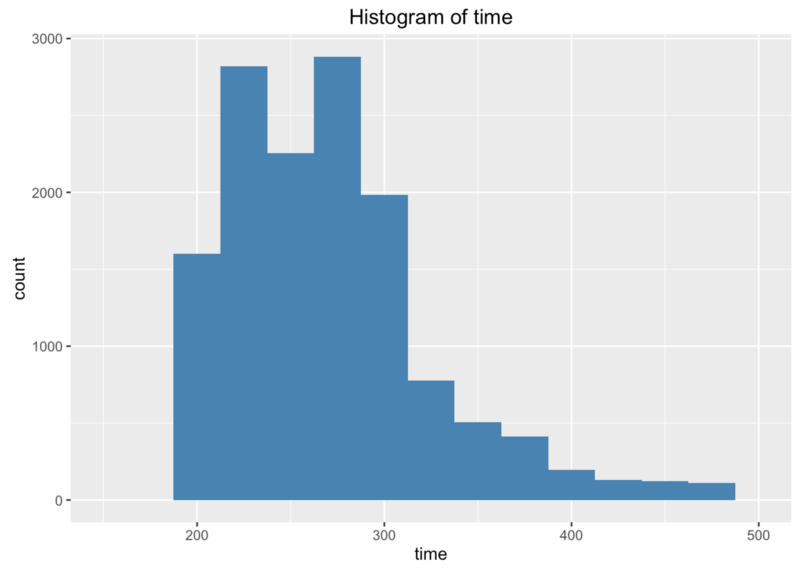
Histogram is not going to help us more, we’re going to try box plot. Much better information.

Left half is without VPC. Right half is with VPC. As you can see, we have lot of requests with duration greater than 5s. To be more precise, with duration in the 7.5-12.5s range.
We have lot of input variables and we have to get rid of them. Let’s limit time to 200-500ms in this box plot.
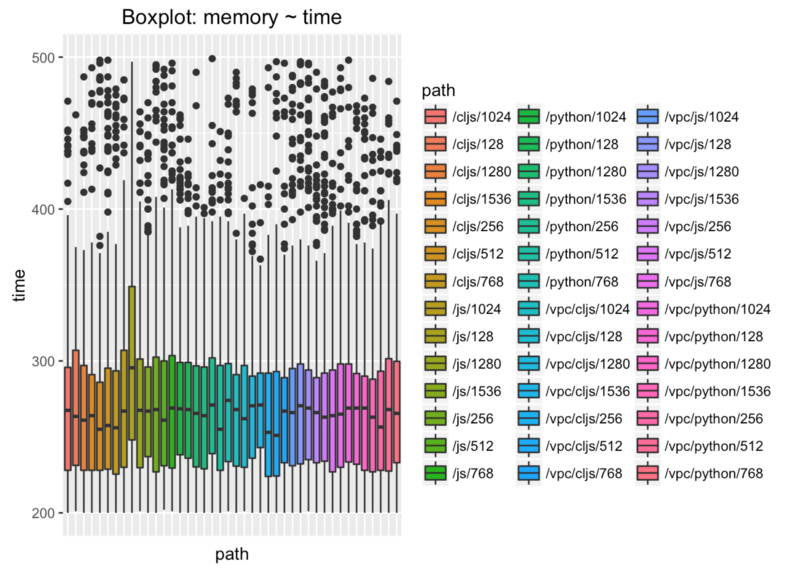
What does it say? If everything works as expected, there’s no difference between languages and memory sizes.
We can safely ignore language and memory size variables. What do we have now? VPC and lambda container reuse variables.
Lambda containers reuse
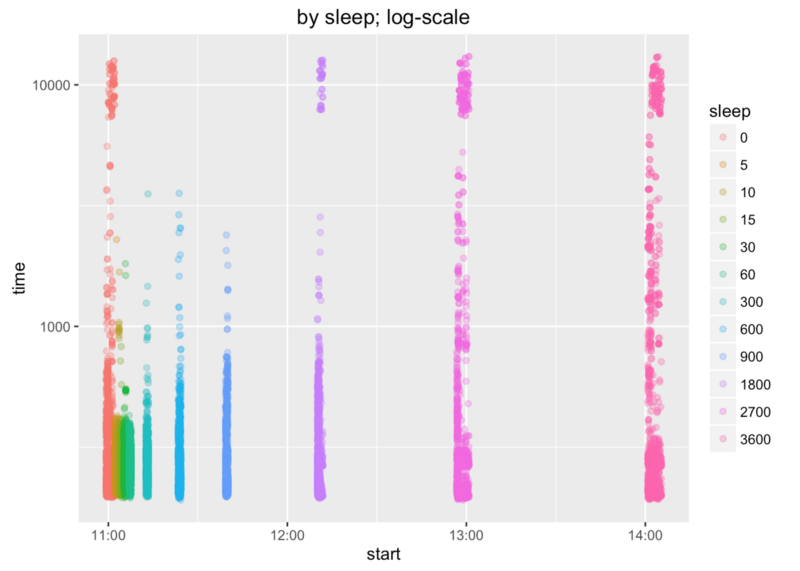
X axis shows when requests were fired and Y axis shows their duration.
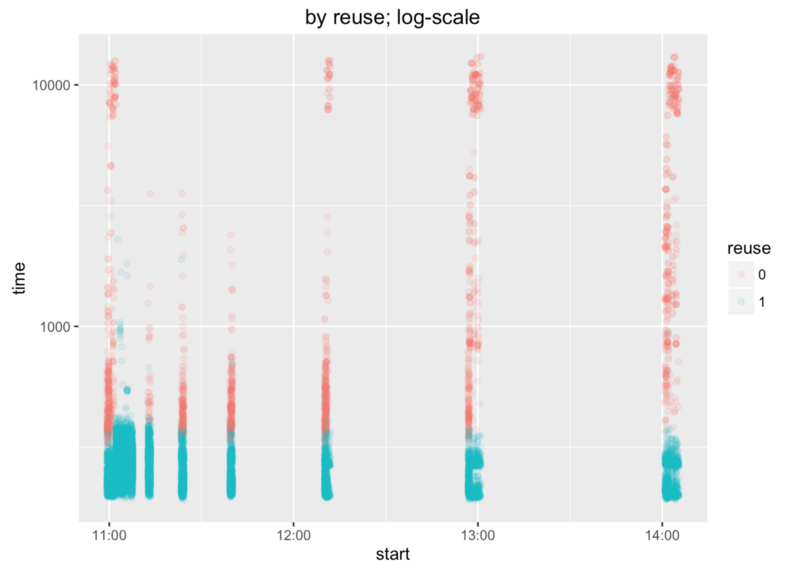
First batch has several durations around 10s. That’s “okay”, because lambda functions were redeployed before benchmark and there were no containers to reuse. But what we can see is that containers weren’t reused about one hour after the benchmark start.
Let’s find more precise time and use more colours. Sleep time of 900s (15m) looks okay. Sleep time of 1800s (30m) doesn’t. We can say that containers are not reused after 15 minutes (rough estimate).
Some numbers and explanation from Tobbi:
To ensure ourselves let’s check the numbers. 2nd and 3rd columns contain sample mean and sample standard deviation. We can see that most of the means are below 300ms. The bold rows have higher means since right-skewed distributions tend to pull mean off.
4th to 6th columns contain a probability that call remains below given time limit using Gaussian distribution, e.g. norm.1000 represents probability the call is below 1000ms. Let’s ignore the bold rows since these distributions are bi-modal and not Gaussian.
The last two columns contain empirical probabilities based on the test data, e.g. emp.500 show the probability the call remains under 500ms.
As we can see, we have pretty reasonable times (below 1 second) for up to 900s gaps.
| sleep | mean | sd | norm.500 | norm.1000 | norm.2000 | emp.500 | emp.1000 |
|---|---|---|---|---|---|---|---|
| 0 | 939 | 2324 | 0.425 | 0.510 | 0.676 | 0.816 | 0.906 |
| 5 | 282 | 69 | 0.999 | 1.000 | 1.000 | 0.999 | 0.999 |
| 10 | 282 | 82 | 0.996 | 1.000 | 1.000 | 0.991 | 0.998 |
| 15 | 277 | 43 | 1.000 | 1.000 | 1.000 | 0.998 | 1.000 |
| 30 | 283 | 74 | 0.998 | 1.000 | 1.000 | 0.990 | 0.998 |
| 60 | 275 | 38 | 1.000 | 1.000 | 1.000 | 1.000 | 1.000 |
| 300 | 287 | 123 | 0.957 | 1.000 | 1.000 | 0.985 | 0.998 |
| 600 | 293 | 204 | 0.843 | 1.000 | 1.000 | 0.960 | 0.991 |
| 900 | 294 | 153 | 0.909 | 1.000 | 1.000 | 0.933 | 0.994 |
| 1800 | 618 | 1757 | 0.473 | 0.586 | 0.784 | 0.867 | 0.960 |
| 2700 | 1423 | 2945 | 0.377 | 0.443 | 0.578 | 0.756 | 0.832 |
| 3600 | 1652 | 3089 | 0.355 | 0.416 | 0.545 | 0.679 | 0.751 |
VPC
Last thing we have to find is how VPC configuration influences all these durations. We’re lucky with another box plot.
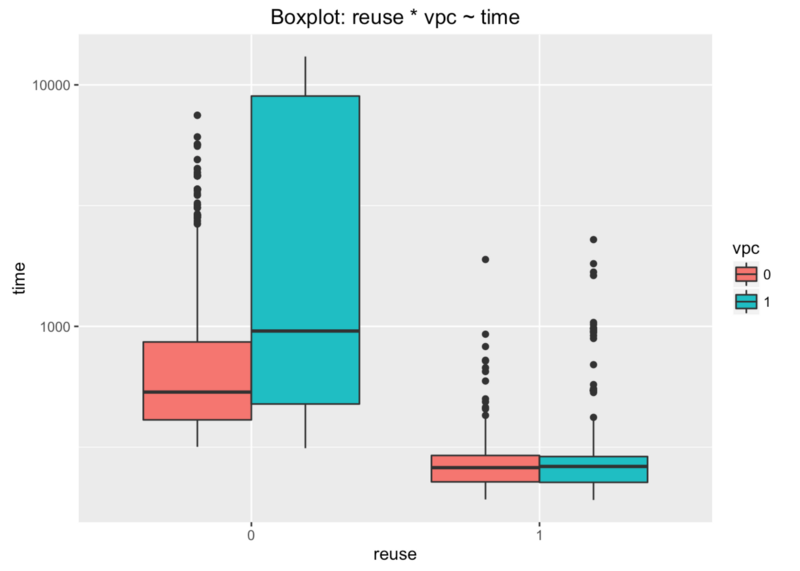
X axis shows if the lambda container was (1) or wasn’t (0) reused. Y axis shows the request duration.
There’s no difference if container is reused. VPC can be set or not. Huge difference is when the container is not reused.
We can say that these unacceptable durations come from lambda functions with VPC when their containers are not reused.
Keep alive containers
We already found that these containers are not reused after ~15 minutes. I tried to keep them alive with quickly hacked keep alive script.
This script fires 10 requests with 10 workers per endpoint to keep alive 10 containers. That’s because our benchmark script also do use 10 workers. These requests are fired in 15 minutes interval. What happened?
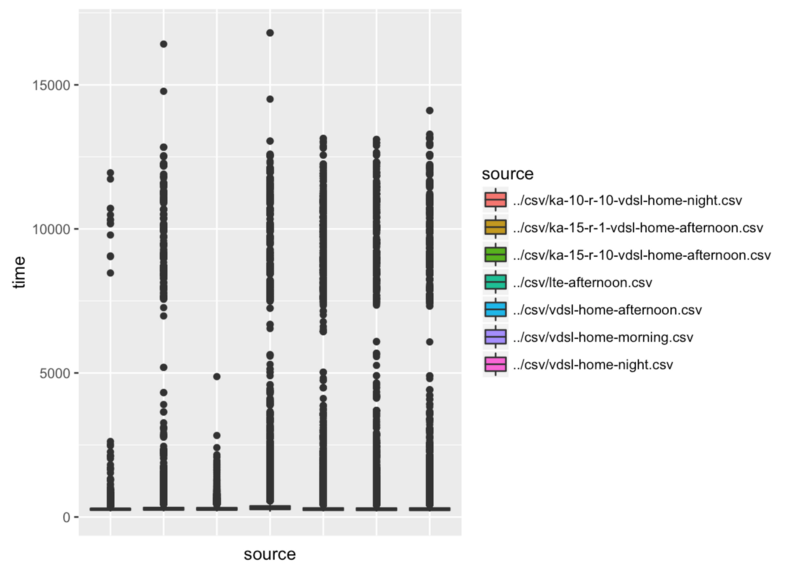
Third data set (ka-15-r-10-vdsl-home-afternoon, keep alive time interval 15m, 10 containers) has one duration just below 5s and rest is in the 0-2.5s range.
Let’s look at the ka-15-r-10-vdsl-home-afternoon data set directly.
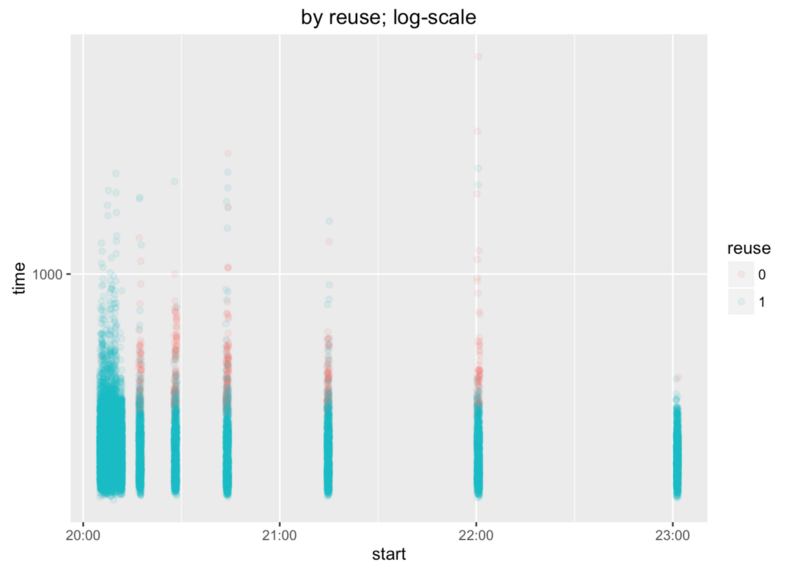
Huge improvement. 10s requests are gone. Compare against vdsl-home-morning data set.

We can say victory 😉 Not victory actually, but huge progress at least.
Conclusion
Be aware that our testing lambda functions are very simple. They just returns lambda container reuse info. These numbers and findings can differ if your lambda has lot of dependencies, does lot of other things, etc.
Based on these facts, we can say that:
- Lambda function language (Python, ClojureScript or JavaScript) has no influence on lambda container initialisation time
- Memory size has no influence on lambda container initialisation time
- VPC has huge impact on lambda container initialisation time when the lambda container is not reused, but have no impact at all (or negligible) when the lambda container is reused
- Lambda containers are not reused after ~15 minutes
- If we issue keep alive requests in the 15 minutes interval, very long request durations (> 5s) are rare
Recommendation?
Use CloudWatch to issue keep alive functions in the 15 minutes interval if you’re using VPC, API Gateway & Lambda functions.
UPDATE: Configurable keep alive function in Python, CloudWatch event rule and CloudFormation template can be found here.
This will not solve your issue completely, but will help a lot. Especially if your lambda function is rarely used and containers are not reused. It’s a nightmare to explain to your user that he has to wait for 15s to get some response from your application.
Not sure if AWS guys will be happy, but what else can we do?
Do you want to play with this benchmark, roll your own analysis, …? Here’s the repository link with all lambda functions, scripts, data sets and HTML outputs.